
Financial markets do not operate in isolation.
The movement of one market can often coincide with, influence, or provide useful context for another. A change in the US dollar may affect commodities. Interest-rate expectations can influence currencies and bonds. Oil prices can affect certain currencies and equity sectors. Even when two markets are not directly connected, they may respond to the same underlying economic forces.
This relationship is known as market correlation.
Understanding correlation can give traders a broader view of what is happening across financial markets instead of analysing a single chart in isolation.
However, correlation is not a guarantee. Relationships can weaken, disappear, or even reverse depending on economic conditions.
This article explains what correlation means, how traders identify it, some of the most commonly observed relationships between markets, and how correlation can be incorporated into a trading strategy.
What Is Correlation in Trading?
Correlation describes the degree to which two assets or markets tend to move in relation to each other.
Imagine two assets:
- Asset A rises when Asset B rises.
- Asset A falls when Asset B falls.
They have a positive correlation.
Now imagine:
- Asset A rises when Asset B falls.
- Asset A falls when Asset B rises.
They have a negative or inverse correlation.
Finally, if the movements of the two assets show little consistent relationship, they may have weak or no correlation.
Correlation is commonly measured using a number between -1 and +1.
| Correlation | General Interpretation |
|---|---|
| +1 | Perfect positive correlation |
| +0.7 | Strong positive relationship |
| +0.3 | Weak positive relationship |
| 0 | No linear relationship |
| -0.3 | Weak negative relationship |
| -0.7 | Strong negative relationship |
| -1 | Perfect negative correlation |
Real financial markets rarely maintain a perfect +1 or -1 relationship.
Positive Correlation Explained
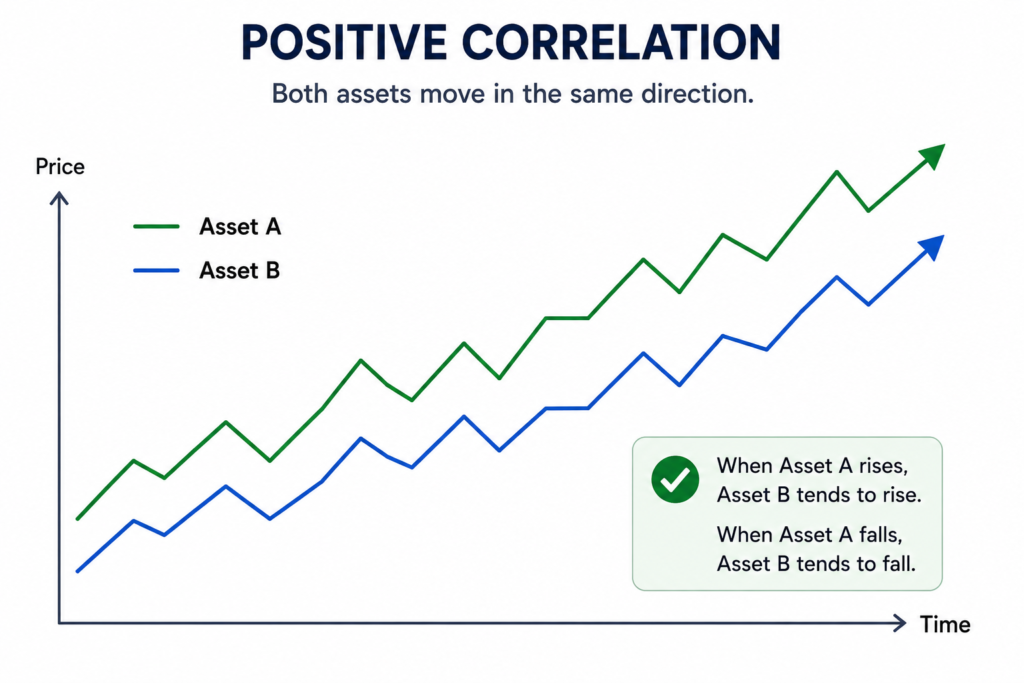
Positive correlation means two assets have historically tended to move in the same direction.
For example, suppose two markets have a strong positive relationship.
When Market A rises, Market B frequently rises as well.
When Market A falls, Market B frequently falls.
This can be useful because movement in one market may provide additional context when analysing the other.
But traders should avoid interpreting correlation as:
“If A goes up, B must go up.”
Correlation describes a historical relationship, not a guaranteed prediction.
Negative Correlation Explained
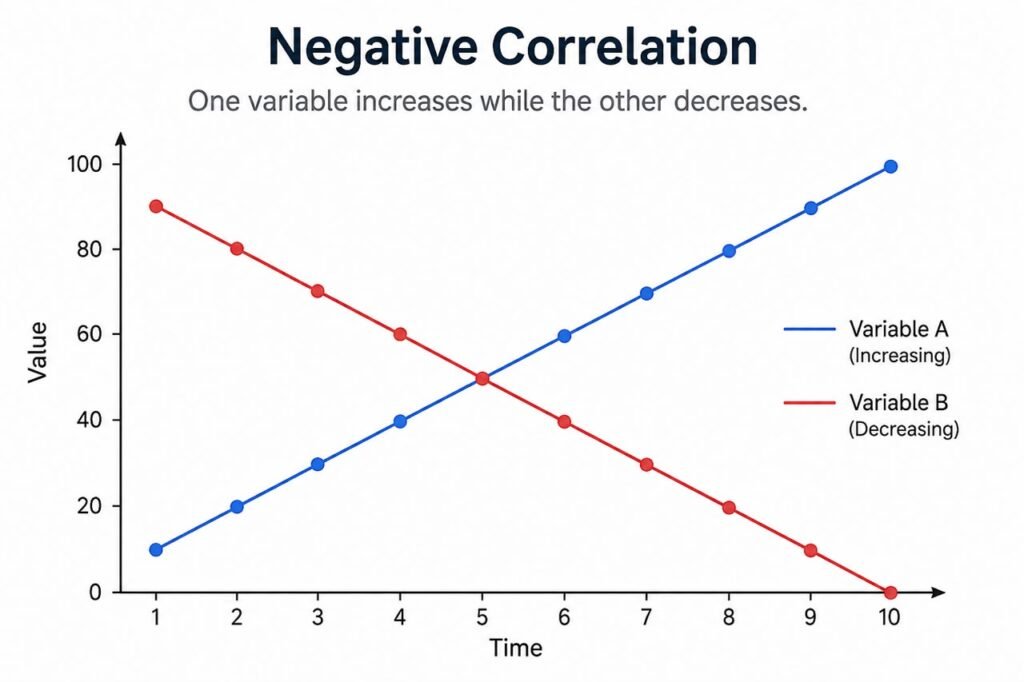
Negative correlation occurs when two assets have historically tended to move in opposite directions.
For example:
Asset A ↑ → Asset B ↓
and:
Asset A ↓ → Asset B ↑
This type of relationship can be particularly interesting to traders because strength in one market may coincide with weakness in another.
However, just like positive correlation, an inverse relationship can change as market conditions change.
Why Do Markets Become Correlated?
Markets can become correlated because they respond to the same underlying factors.
These factors can include:
- Interest rates
- Inflation
- Economic growth
- Central-bank policy
- Investor sentiment
- Risk appetite
- Geopolitical events
- Commodity prices
- Currency movements
- Global liquidity
For example, if investors suddenly become concerned about economic conditions, they may reduce exposure to riskier assets and move toward assets they perceive as safer.
Several markets may therefore move at the same time.
The important point is that correlation does not necessarily mean one asset is directly causing another asset to move.
Both could be responding to the same third factor.
Common Market Correlations Traders Watch
Some relationships appear frequently enough in financial-market analysis to deserve attention.
1. US Dollar and Gold
Gold is often discussed in relation to the US dollar.
Because gold is generally priced in US dollars, changes in the dollar can affect the price of gold.
Historically, gold and the dollar have often displayed an inverse relationship, although the strength of that relationship can vary significantly.
For example:
Dollar strengthens → Gold may face downward pressure
Dollar weakens → Gold may receive upward support
But this relationship is not permanent.
Inflation expectations, interest rates, geopolitical uncertainty and demand for safe-haven assets can all influence gold.
2. US Dollar and Oil
Oil is another market that traders frequently compare with the US dollar.
Crude oil is commonly priced in dollars internationally. Therefore, changes in the value of the dollar can influence the purchasing power of buyers using other currencies.
However, oil prices are also heavily influenced by:
- Supply and demand
- OPEC+ decisions
- Geopolitical events
- Production disruptions
- Global economic growth
- Inventory levels
Therefore, traders should not assume that every movement in the dollar will automatically produce an opposite movement in oil.
3. Oil and Commodity-Linked Currencies
Some currencies are closely watched alongside commodity markets because their economies have significant exposure to commodity exports.
The Canadian dollar (CAD) is one example because Canada is a major energy producer and exporter.
Traders may therefore monitor:
WTI Crude Oil ↔ USD/CAD
If oil prices rise significantly, the Canadian dollar may benefit under certain conditions, which can contribute to downward pressure on USD/CAD.
But again, this is a relationship—not a trading rule.
Interest-rate expectations, Canadian economic data and broader US dollar strength can overwhelm the oil relationship.
4. USD/JPY and US Treasury Yields
Interest rates and bond yields can have an important relationship with currencies.
USD/JPY is often monitored alongside US Treasury yields because changes in US yields can influence the attractiveness of US-dollar-denominated assets relative to Japanese assets.
For example, rising US yields can sometimes support the US dollar against the yen.
But the relationship can change when markets experience major shifts in risk sentiment or Japanese monetary policy.
5. Stock Markets and Bond Markets
Equities and bonds can also show changing relationships.
In some environments, investors may move money from stocks toward bonds when they become more cautious.
In other environments, stocks and bonds can decline together, particularly when inflation and interest-rate expectations become dominant concerns.
This demonstrates an important lesson:
Correlation is dynamic.
A relationship that worked well in one economic environment may behave differently in another.
Correlation Is Not Causation
This is one of the most important concepts traders should understand.
If two markets frequently move together, it does not automatically mean that one causes the other.
Imagine:
Market A rises
Market B rises
You might conclude that A caused B.
But there could be another explanation.
Perhaps both markets responded to:
Interest-rate expectations
or:
A major economic announcement
or:
Changes in investor risk appetite
This is why correlation should be used as context, rather than treated as proof of cause and effect.
How Traders Can Use Correlation
Correlation can potentially be useful in several areas of trading.
1. Confirming Market Conditions
Suppose a trader is analysing gold.
Instead of looking only at the gold chart, they may also monitor the US dollar.
If gold is breaking higher while the dollar is simultaneously weakening, the relationship may provide additional context.
It does not guarantee that gold will continue rising, but it gives the trader another piece of information.
2. Identifying Potential Contradictions
Correlation can also highlight situations where markets are behaving unusually.
For example:
A trader expects a strong dollar environment, but several historically related markets are behaving differently.
That could encourage the trader to investigate further.
Perhaps:
- A new economic report has changed expectations.
- Central-bank policy has shifted.
- Market sentiment has changed.
- The historical correlation is temporarily weakening.
Instead of blindly taking a trade, the trader can ask:
“Why are these markets behaving differently?”
That question can be more valuable than the correlation itself.
3. Managing Portfolio Risk
Correlation becomes particularly important when a trader holds multiple positions.
Consider two hypothetical trades:
- Long EUR/USD
- Long GBP/USD
At first glance, these appear to be two separate trades.
But both involve exposure to the US dollar and both currencies can respond to similar macroeconomic factors.
Therefore, the trader may effectively have more concentrated exposure than they realise.
Correlation can help traders identify this hidden concentration.
Correlation and Diversification
Many traders assume that having multiple positions automatically means they are diversified.
That isn’t necessarily true.
Imagine a portfolio containing:
- Gold
- Silver
- A gold-mining stock
- Another precious-metals ETF
Although these are technically different instruments, they may share substantial exposure to the same underlying theme.
If the underlying factor moves against the trader, several positions could lose money simultaneously.
This is why diversification should consider correlation, not simply the number of assets held.
Correlation Can Change
One of the biggest mistakes is assuming that a historical correlation will always remain intact.
Markets constantly change.
A relationship can become:
Strong → Weak
or:
Positive → Negative
depending on the environment.
For example, during one period, investors may focus heavily on interest rates.
During another period, geopolitical risk may dominate.
During another, supply-and-demand dynamics may become more important.
As the dominant market driver changes, relationships between assets can change as well.
What Is a Correlation Matrix?
A correlation matrix is a simple way of viewing relationships between multiple assets.
For example, a trader could compare:
- EUR/USD
- GBP/USD
- USD/JPY
- Gold
- Oil
- S&P 500
- Bitcoin
The resulting matrix can show which assets have historically moved together and which have tended to move in opposite directions.
This can be particularly useful when analysing a portfolio rather than a single trade.
Correlation and Timeframes
Correlation can also depend on timeframe.
Two assets might have a strong relationship over several years but a weak relationship over the last few weeks.
Similarly, two markets might appear highly correlated on a daily chart but behave very differently intraday.
Therefore, traders should ask:
“Over what period am I measuring this correlation?”
This is especially important when developing systematic trading strategies.
Correlation in Algorithmic Trading
This is where correlation becomes particularly interesting for AI and automation.
A manual trader may look at several charts and mentally identify relationships.
An automated system can potentially monitor many markets simultaneously.
For example, an algorithm could track:
- Currency prices
- Commodity prices
- Bond yields
- Equity indices
- Volatility measures
- Economic data
It could then calculate how relationships between these markets are changing over time.
Instead of simply asking:
“Are these markets correlated?”
a more sophisticated system might ask:
“Is the current relationship significantly different from its historical behaviour?”
That distinction can be extremely valuable.
AI and Dynamic Market Correlation
Artificial intelligence and machine-learning systems can potentially analyse large amounts of historical market data and identify changing relationships.
For example, a system could examine:
USD → Gold → Oil → Treasury yields → Equity indices
and monitor how their relationships evolve.
It could potentially identify periods when:
- Correlation is strengthening.
- Correlation is weakening.
- A historical relationship has broken down.
- Multiple markets are responding to the same event.
However, AI does not make correlation predictable with certainty.
A model can identify patterns in historical data, but markets remain uncertain and relationships can change unexpectedly.
A Simple Example
Imagine a trader is considering a long position on gold.
Instead of analysing gold alone, the trader checks:
Gold
Showing bullish price structure.
US Dollar
Showing weakness.
Treasury yields
Beginning to decline.
Market sentiment
Becoming more defensive.
The trader now has several pieces of information that appear consistent with the gold thesis.
This doesn’t mean the trade will succeed.
But the trader has moved from:
“Gold looks bullish.”
to:
“Several related market factors are currently consistent with my thesis.”
That is a much more comprehensive way of analysing markets.
Common Mistakes Traders Make With Correlation
Mistake 1: Assuming correlation guarantees a trade
It doesn’t.
Mistake 2: Treating correlation as causation
Two markets can move together because they respond to the same underlying factor.
Mistake 3: Using outdated correlations
A relationship from several years ago may not accurately represent the current market environment.
Mistake 4: Ignoring timeframe
Short-term and long-term correlations can tell very different stories.
Mistake 5: Assuming correlation is permanent
Markets evolve, and relationships can break down.
Mistake 6: Using too many correlated positions
Multiple trades can create much greater risk exposure than the trader realises.
How to Incorporate Correlation Into a Trading Process
A simple framework could be:
Step 1: Identify the market you want to trade
For example:
Gold
Step 2: Identify related markets
Potentially:
- US Dollar
- Treasury yields
- Silver
- Mining stocks
Step 3: Examine their current behaviour
Are they confirming or contradicting your market thesis?
Step 4: Check the timeframe
Is the relationship relevant to your trading horizon?
Step 5: Consider the broader economic environment
What is currently driving the markets?
Step 6: Make the trading decision based on your complete strategy
Correlation should be one input, not the entire strategy.
The Future of Correlation Analysis
As financial markets become increasingly data-driven, traders have access to more information than ever before.
The challenge is no longer simply finding data.
The challenge is determining which relationships actually matter.
This creates opportunities for automation and AI systems to monitor relationships across hundreds or thousands of instruments much faster than a human could manually analyse them.
A future trading workflow might therefore combine:
Market Structure + Correlation + Fundamental Data + Sentiment + Risk Management + Automation
Rather than relying on a single indicator or isolated chart.
tool for market analysis.
For traders building systematic or automated strategies, correlation can become even more useful because software can continuously monitor multiple markets, calculate relationships and identify changes that may be difficult to spot manually.
But correlation remains probabilistic, not predictive certainty. It should complement a well-defined trading strategy and robust risk-management process—not replace them.
Important: Correlation is based on historical relationships and does not guarantee future market movements. Financial markets involve substantial risk, and traders should conduct appropriate research and risk assessment before making investment decisions.
Visit our store to explore our trading solutions