
Liquidity is one of the most frequently used — and frequently misunderstood — concepts in trading.
Traders talk about liquidity pools, liquidity sweeps, stop hunts, buy-side liquidity and sell-side liquidity, but underneath all of these ideas is a much simpler question:
What actually makes price move from one level to another? The answer begins with orders and available liquidity.
What Is Liquidity?
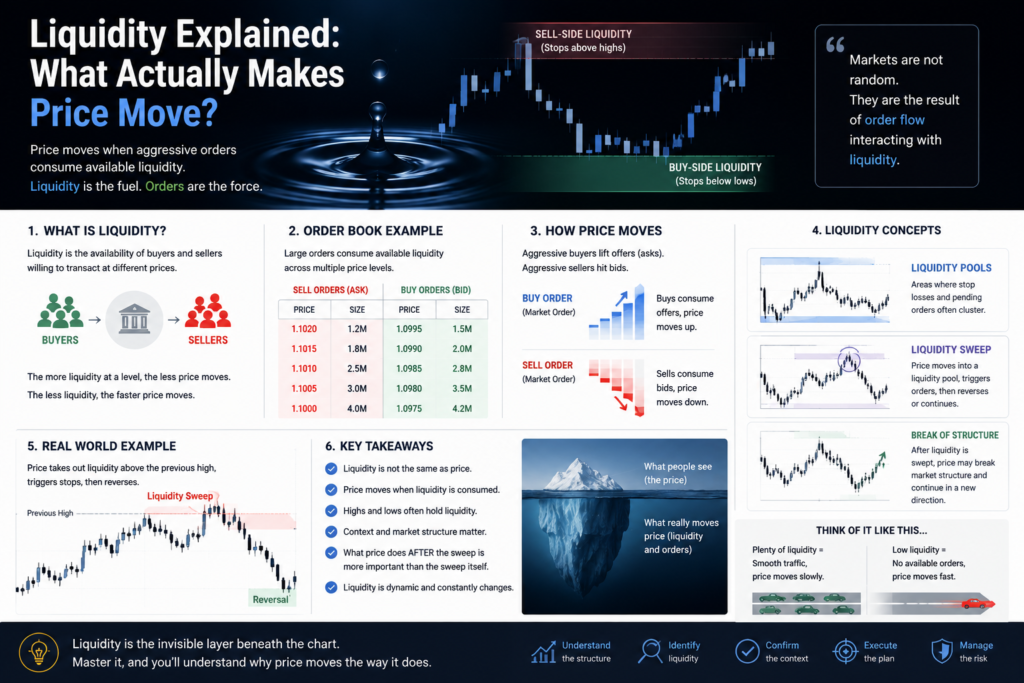
In financial markets, liquidity broadly refers to the availability of buyers and sellers willing to transact at different prices.
Imagine a market where there are many sell orders available around a particular price. A buyer can execute a large order without pushing the market very far because there is plenty of supply available.
Now imagine there are very few sell orders above the current price.
If aggressive buyers enter the market, they may have to consume the available sell orders at progressively higher prices.
Price moves upward because available liquidity at lower prices is being consumed.
The same principle works in reverse.
If aggressive sellers enter a market with limited buying liquidity below the current price, they can consume available bids and force price lower.
This is the foundation of price movement.
Liquidity Is Not the Same as Price
A common misconception is that liquidity itself “pulls” price toward a level.
Liquidity is better understood as available orders that can facilitate transactions.
For example, consider a simplified order book:
| Price | Available Sell Orders |
|---|---|
| 101.00 | 500 |
| 101.50 | 800 |
| 102.00 | 1,200 |
| 102.50 | 2,000 |
If aggressive buyers want to purchase 3,000 units, they cannot necessarily buy everything at 101.00.
They consume the available liquidity:
- 500 at 101.00
- 800 at 101.50
- 1,200 at 102.00
- Remaining orders at higher prices
The average execution price therefore rises.
This is essentially price discovery in action.
Bid, Ask and the Mechanics of Movement
To understand liquidity properly, you need to understand the two sides of the market.
The bid represents the highest price buyers are currently willing to pay.
The ask represents the lowest price sellers are currently willing to accept.
The difference between them is the spread.
Limit orders can provide liquidity by waiting for someone else to execute against them.
Market orders, by contrast, are aggressive orders that seek immediate execution and therefore consume available liquidity.
A simplified example:
Bid: $100.00
Ask: $100.05
If a large market buy order arrives, it executes against available sellers at the ask.
If there isn’t enough liquidity at $100.05, the order may continue filling at $100.06, $100.07, $100.08 and so on.
The market has moved higher because the available sell-side liquidity was consumed.
What Traders Mean by “Liquidity Above Highs”
Technical traders often use the term liquidity differently.
When traders say:
“There is buy-side liquidity above these highs.”
They are usually referring to orders that may be concentrated around obvious price levels, particularly stop orders from traders holding short positions.
For example, imagine a market repeatedly reaches $105 but fails to break higher.
Many traders may place their stop-loss orders for short positions just above $105.
Those stops represent potential buying activity if triggered.
Therefore, the area above the previous high can become an important zone to watch.
The same principle applies below obvious lows.
Traders holding long positions may place protective stops underneath those lows, creating potential selling activity if those stops are triggered.
This gives us two commonly used concepts:
Buy-side liquidity → often associated with potential buy orders above highs
Sell-side liquidity → often associated with potential sell orders below lows
What Is a Liquidity Sweep?
A liquidity sweep occurs when price moves through an area where traders expect liquidity to exist and then reverses or continues depending on the broader market conditions.
Consider a simple example.
Price reaches a previous high:
High = 1.2500
Many traders are watching this level.
Price moves to:
1.2505 → 1.2510 → 1.2515
Short sellers may have stops above the previous high.
Once those orders are triggered, additional buying can enter the market.
But triggering liquidity does not automatically mean price must reverse.
This is an important distinction.
A sweep can be followed by:
- A sharp reversal
- Continued breakout
- Consolidation
- Further expansion
The liquidity event itself is not a trading signal.
Context determines what happens next.
Does Price “Go Looking for Liquidity”?
You’ll often hear traders say:
“The market is going to hunt liquidity.”
This language can be useful as shorthand, but it can also create a misleading mental model.
Price does not necessarily have an intention to “hunt” stops.
Markets are the result of interactions between buyers, sellers, orders, liquidity providers, algorithms and changing expectations.
If a large amount of executable liquidity exists around a particular price, that area can become important because it allows significant transactions to occur.
So instead of thinking:
“Price wants to hunt the stops.”
A more useful framework is:
“There may be a concentration of executable orders around this level, which can influence how price behaves when the level is reached.”
That distinction matters.

Liquidity and Market Structure
Liquidity becomes much more powerful when combined with market structure.
Suppose a market is making:
Higher High → Higher Low → Higher High → Higher Low
The market is displaying bullish structure.
Now price drops below a previous low, triggering potential sell-side liquidity, but quickly recovers and breaks to a new high.
A trader might interpret this as:
- Sell-side liquidity was accessed.
- Sellers failed to maintain control.
- Buyers regained momentum.
- Bullish structure continued.
The liquidity event is therefore only one piece of the analysis.
The important question is:
What did price do after interacting with the liquidity?
Liquidity vs Volume
Liquidity and volume are related, but they are not the same thing.
Volume tells you how much trading activity occurred.
Liquidity describes the availability of orders that can absorb buying or selling without causing significant price movement.
A market can experience high volume while still moving dramatically if liquidity is thin.
This is one reason major economic announcements can produce extreme volatility.
When market participants rapidly adjust their positions, available liquidity can change while aggressive orders enter the market.
The result can be rapid price movement.
Why Economic News Can Create Liquidity Problems
Consider a major CPI or NFP release.
Before the announcement, traders may have orders positioned around the current market price.
When the data arrives, algorithms and institutions can react almost simultaneously.
Orders may be cancelled, added or aggressively executed.
The result can be:
More aggressive order flow + changing available liquidity = rapid price movement
This is why traders often see unusually large candles around major economic releases.
The market isn’t simply “moving because the news was good.”
It is repricing based on the information — while the balance between available liquidity and aggressive order flow is changing.
Liquidity Is Dynamic
One of the most important things to understand is that liquidity isn’t fixed.
The order book changes continuously.
Orders can:
- Be added
- Be cancelled
- Be filled
- Be moved
- Become less attractive as price changes
Therefore, a liquidity level that appears significant at one moment may become irrelevant minutes later.
This is particularly important when analysing markets using historical charts.
A chart can show you where price traded, but it does not always show you the complete order-book conditions that existed at that exact moment.
That means traders should be cautious about assuming that every historical wick represents a deliberate “liquidity grab.”

The Practical Framework
Instead of simply marking every previous high and low as a liquidity pool, ask five questions:
1. Where are the obvious highs and lows?
These are areas where traders are more likely to have positioned stops or breakout orders.
2. What is the broader market structure?
Is the market trending, ranging or transitioning?
3. What happened when price reached the level?
Did price reject it, break through it or consolidate?
4. Was there meaningful displacement afterward?
A strong move away from a level can provide more information than the initial sweep itself.
5. Does the event agree with the larger market narrative?
Liquidity should be analysed alongside momentum, volatility, news, market structure and higher-timeframe context.
The Bigger Picture
Liquidity is not a magical force that attracts price.
It is part of the mechanism through which markets facilitate transactions and discover prices.
When aggressive buying consumes available sell-side liquidity, price can move higher.
When aggressive selling consumes available buy-side liquidity, price can move lower.
Obvious highs and lows can become important because they often attract orders such as stops and breakout entries.
But identifying liquidity is only the beginning.
The more important question is:
What happens after that liquidity is interacted with?
That is where liquidity connects with market structure, order flow, volatility and price discovery.
Understanding this distinction can help traders move away from simplistic ideas like “the market hunts stops” and toward a more useful understanding of how orders, liquidity and price actually interact.
Key Takeaway
Liquidity doesn’t predict where price must go.
It helps explain how price can move once buying and selling pressure interact with the orders available in the market.
The real edge comes from understanding where liquidity may exist, why it matters, and what price does after interacting with it.
Visit our store to explore our trading solutions