
Economic data can move financial markets faster than almost anything else.
A currency pair can move dozens of pips within seconds. Bond yields can reprice almost instantly. Stock indices can rally or fall sharply. Gold can reverse direction before many traders have even had time to understand what was released.
But why?
The answer is that financial markets are constantly trying to price the future.
Traders aren’t simply reacting to whether the economy is “good” or “bad.” They are trying to determine what new economic information means for inflation, economic growth, employment, monetary policy and ultimately interest rates.
Four of the most important pieces of information in this process are:
- CPI — Consumer Price Index
- NFP — Non-Farm Payrolls
- GDP — Gross Domestic Product
- Interest rates and central-bank decisions
Understanding these indicators is therefore less about memorising definitions and more about understanding the relationships between them.
The Big Picture: What Are Markets Actually Watching?
Before looking at each indicator individually, it helps to understand the chain connecting them.
A simplified version looks like this:
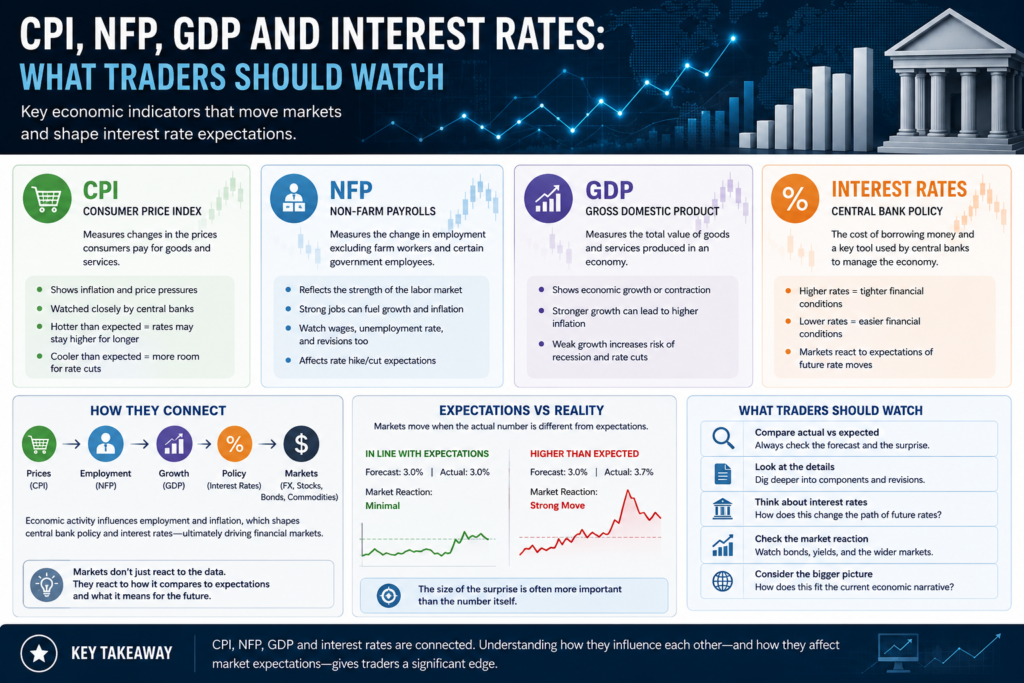
Economic activity → Employment → Consumer demand → Inflation → Central-bank policy → Interest rates → Financial markets
The real economy is much more complicated than this, but the framework is useful.
If economic activity is strong, companies may hire more workers. Strong employment can support household incomes and spending. Strong demand can contribute to inflationary pressure.
If inflation becomes persistently high, a central bank may decide that monetary policy needs to remain restrictive. That can mean higher interest rates for longer.
Conversely, if economic growth weakens, unemployment rises and inflation falls, a central bank may have more room to lower interest rates.
And because interest rates affect the attractiveness of currencies, bonds, equities and other assets, traders pay close attention to the data that could influence future policy.
The crucial word here is expectations.
Markets don’t only care about what happened.
They care about whether what happened was better or worse than expected.
1. CPI: The Inflation Report Traders Watch
CPI stands for Consumer Price Index.
It measures changes over time in the prices consumers pay for a broad basket of goods and services.
In simple terms, CPI helps answer:
Are things becoming more expensive, and how quickly?
Inflation matters because persistent increases in prices can influence household purchasing power, business costs and monetary policy.
For traders, however, the most important question is often:
What does this inflation data mean for future interest rates?
Why CPI Moves Markets
Suppose markets expect inflation to come in at 3.0%.
The actual number arrives at 3.4%.
That is a hotter-than-expected inflation reading.
Traders may reason that inflation is proving more persistent than anticipated. If the central bank is concerned about inflation, it may therefore be less likely to cut interest rates quickly — or may keep rates higher for longer.
That can affect:
- Government bond yields
- The currency
- Equity indices
- Gold
- Interest-rate expectations
The opposite can happen when inflation comes in significantly below expectations.
Headline CPI vs Core CPI
One important distinction is between headline inflation and core inflation.
Headline CPI includes the full basket, including volatile components such as food and energy.
Core CPI generally excludes food and energy to provide a measure that is less affected by short-term fluctuations in those categories.
Neither number should automatically be treated as “the real inflation number.”
They answer slightly different questions.
A large movement in energy prices, for example, can significantly influence headline inflation even if underlying price pressures are changing more gradually.
What Traders Should Watch
Don’t simply look at:
CPI = 3.4%
Instead ask:
- What was the previous reading?
- What was the market expecting?
- Was the actual figure above or below expectations?
- Did core inflation move in the same direction?
- Which components contributed to the change?
- What does the release imply for future central-bank policy?
This is where economic analysis becomes much more useful than simply reading the headline number.
2. NFP: What the Jobs Report Tells Traders
NFP stands for Non-Farm Payrolls.
It is one of the most closely watched components of the U.S. employment report and measures the change in employment across the U.S. economy, excluding certain categories such as farm workers and some government and household employment.
At its simplest, NFP answers:
Are employers adding or removing jobs?
But traders rarely analyse the payroll number in isolation.
The broader employment report contains several other pieces of information that can be extremely important.
These include:
- Unemployment rate
- Average hourly earnings
- Labour-force participation
- Revisions to previous payroll figures
- Employment changes across sectors
Why NFP Can Cause Huge Volatility
Imagine economists expect:
+180,000 jobs
The actual number is:
+320,000 jobs
At first glance, this looks strongly positive.
But now consider the rest of the report.
Suppose:
- Unemployment rises
- Wage growth slows
- Previous payroll numbers are revised lower
The market’s interpretation could become much more complicated.
This is why the phrase “NFP came in strong” doesn’t necessarily tell you what happened to markets.
Markets respond to the entire information set.
Wage Growth Matters
Average hourly earnings can be particularly important because wages influence household income and spending.
If employment is strong and wages are accelerating, traders may become more concerned about persistent inflationary pressure.
But if payroll growth is strong while wage growth is slowing, the inflation implications may be different.
Again, the important question is not:
“Was NFP good?”
It is:
“What does this employment report imply about economic conditions and future monetary policy?”
3. GDP: Measuring Economic Growth
GDP stands for Gross Domestic Product.
It measures the monetary value of final goods and services produced within an economy over a particular period.
In simple terms, GDP gives traders an indication of the size and growth rate of economic activity.
A growing economy generally indicates expanding economic activity.
A contracting economy indicates weakening activity.
But even here, traders need to think beyond the headline.
Why GDP Matters to Traders
Suppose a country’s economy is growing much faster than expected.
That may suggest:
- Stronger economic activity
- Stronger demand
- Greater resilience
- Potentially greater inflationary pressure
- Less urgency for monetary easing
But once again, expectations matter.
If the market expects GDP growth of 2.5% and receives 2.5%, the release may produce relatively little reaction.
If the market expects 2.5% but receives 3.5%, the information is different.
GDP and Interest Rates
GDP becomes particularly interesting when combined with inflation.
Consider two simplified scenarios.
Scenario A
- GDP strong
- Employment strong
- Inflation high
The market may expect monetary policy to remain restrictive.
Scenario B
- GDP weak
- Employment weakening
- Inflation falling
The market may expect greater scope for monetary easing.
This is why economic indicators should not be treated as isolated signals.
4. Interest Rates: The Central Piece of the Puzzle
If CPI, NFP and GDP are pieces of the puzzle, interest rates are often one of the most important consequences traders are trying to anticipate.
Central banks use monetary policy to influence financial conditions and, ultimately, economic activity and inflation.
A central bank can raise, lower or maintain its policy rate depending on its assessment of economic conditions.
Why Interest Rates Matter to Currency Traders
Imagine two countries.
Country A has a policy rate of 5%.
Country B has a policy rate of 2%.
All else being equal, assets denominated in Country A’s currency may offer more attractive interest income.
But currencies don’t move simply because one country has a higher interest rate.
Markets care about relative expectations.
Suppose Country A currently has rates at 5%, but traders expect aggressive rate cuts.
Country B has rates at 3%, but traders expect rates to rise.
The currency relationship can therefore move in ways that seem counterintuitive if you only look at the current interest-rate levels.
The market is constantly asking:
What will interest rates be in the future?
The Most Important Concept: Expectations vs Reality
This is perhaps the most important lesson for anyone trading economic news.
A market does not wait for an economic report to learn what the number is.
It has already formed an expectation.
That expectation is reflected in prices before the release.
Consider a simple example.
Before the release
Expected CPI: 3.0%
Actual CPI: 3.0%
The result is broadly in line with expectations.
There may be relatively little reaction.
Now consider:
Expected CPI: 3.0%
Actual CPI: 3.7%
That is a substantial upside surprise.
The market may suddenly reassess the probability of future rate cuts.
That repricing can affect multiple markets simultaneously.
This is why economic surprises can matter more than the absolute value of the economic indicator.
Why “Good News” Can Be Bad for Stocks
This is one of the most confusing concepts for newer traders.
Suppose the economy creates far more jobs than expected.
You might think:
Strong jobs = good economy = stocks should rise.
Sometimes they do.
But there is another possibility.
Strong employment may suggest the economy is running hotter than expected.
That could mean inflation remains elevated.
That could cause traders to expect interest rates to remain higher for longer.
Higher expected interest rates can increase the discount rate applied to future corporate earnings and can tighten financial conditions.
As a result, equities could actually fall following apparently positive economic data.
The same logic can work in reverse.
Weak economic data may initially look negative, but if it increases expectations of monetary easing, some assets can respond positively.
This is why “good news” and “bad news” are not reliable trading signals by themselves.
CPI, NFP and GDP Don’t Always Agree
Another common mistake is assuming that all economic indicators should tell the same story.
They don’t.
Imagine the following environment:
- GDP growth is slowing
- Employment remains strong
- Wage growth remains elevated
- CPI remains above target
What does that mean?
There isn’t necessarily an obvious answer.
The economy could be losing momentum while inflation remains persistent.
This creates a difficult environment for monetary policymakers.
Traders then have to determine which data is likely to matter most to the central bank’s reaction function.
This is why professional economic analysis is less about finding a single “bullish” or “bearish” indicator and more about constructing a coherent picture.
A Practical Framework for Trading Economic Releases
Rather than memorising individual numbers, traders can use a structured process.
Step 1: Know the Market Expectation
Before an important release, identify the consensus expectation.
You need a baseline.
Without a baseline, you cannot properly judge whether the result was surprising.
Step 2: Compare Actual vs Expected
Ask:
Was the result higher, lower or roughly in line with expectations?
The size of the surprise matters.
A tiny deviation may have little significance.
A major deviation can trigger substantial repricing.
Step 3: Examine the Details
Don’t stop at the headline.
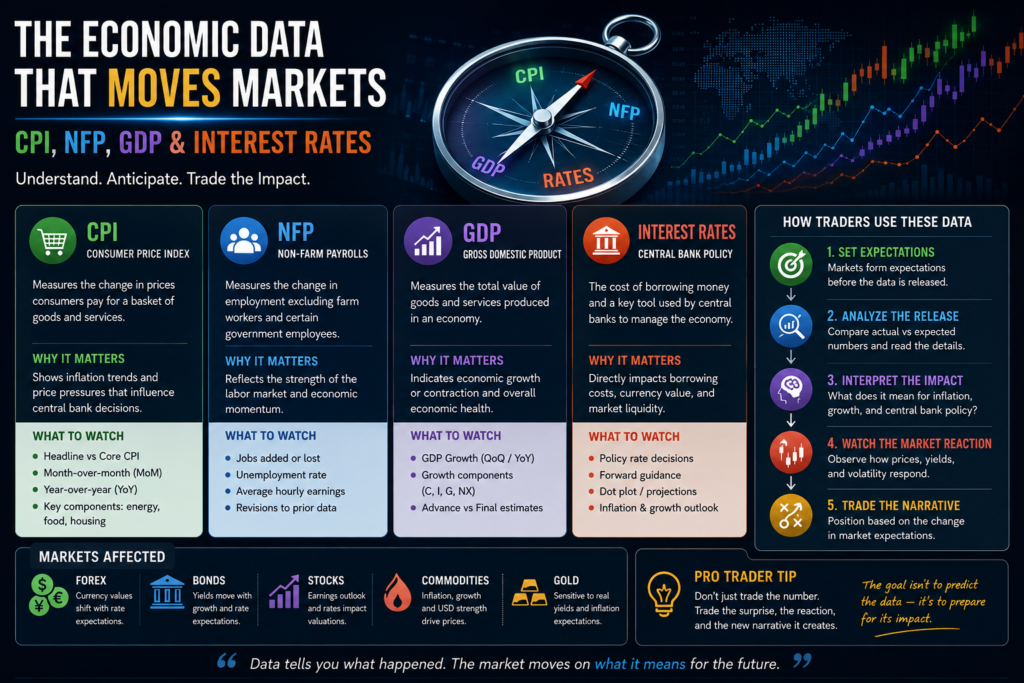
For NFP, examine employment, unemployment, wages and revisions.
For CPI, examine headline and core inflation and the major components.
For GDP, examine the underlying contributors to growth and whether the result was materially different from expectations.
Step 4: Ask What It Means for Interest Rates
This is the critical step.
Don’t immediately jump from:
CPI ↑ → USD ↑
Instead think:
CPI ↑ → inflation expectations may change → rate expectations may change → bond yields may change → currency valuation may change
There are several links in the chain.
Step 5: Compare With the Existing Narrative
Markets are always operating within a broader narrative.
If traders have spent months expecting inflation to fall, one hotter CPI report may challenge that narrative.
If inflation has been unexpectedly persistent for months, another high CPI reading may be less surprising.
The same number can therefore produce different market reactions depending on the surrounding environment.
The Relationship Between the Four Indicators
A useful way to think about these indicators is as different windows into the same economy.
| Indicator | What it tells you | Why traders care |
|---|---|---|
| CPI | Price pressures | Inflation and policy expectations |
| NFP | Employment conditions | Labour-market strength and wage pressure |
| GDP | Economic activity | Growth and recession risk |
| Interest Rates | Monetary-policy stance | Borrowing costs, yields and asset valuations |
But the relationship between them is more important than any single number.
For example:
GDP ↑
may indicate stronger economic activity.
That can support:
Employment ↑
which can support:
Income and spending ↑
which can contribute to:
Inflation ↑
which can influence:
Central-bank policy ↑
which can affect:
Interest-rate expectations ↑
which can ultimately affect:
Currencies, bonds, equities, commodities and other financial assets.
The actual economy is far more complex than this chain, but it provides a useful mental model.
Why Traders Shouldn’t Trade the Number Alone
One of the biggest mistakes around economic releases is assuming that the data itself tells you what price should do.
It doesn’t.
Markets are forward-looking.
Price reflects expectations, positioning, liquidity, risk appetite and countless other variables.
A strong NFP report doesn’t guarantee that the dollar will rise.
A weak CPI report doesn’t guarantee that gold will rise.
A rate hike doesn’t automatically mean a currency will strengthen.
The key question is always:
What changed in the market’s expectations because of this information?
That is a much more powerful question than simply asking whether the number was “good” or “bad.”
Economic Data and Market Volatility
Major economic releases can create unusual trading conditions.
Liquidity can change rapidly.
Spreads can widen.
Price can move sharply in both directions.
Stop orders can be triggered.
Slippage can increase.
And the first price move isn’t necessarily the final market reaction.
This is particularly important for automated trading systems.
An algorithm that simply sees:
CPI > forecast → Buy USD
is missing much of the complexity.
A more sophisticated system might need to consider:
- Magnitude of the surprise
- Previous revisions
- Multiple economic indicators
- Market positioning
- Current monetary-policy expectations
- Bond-market reaction
- Cross-asset relationships
- Volatility
- Liquidity
- Time of day
- Existing market regime
This is one reason why economic-data automation is considerably more complex than creating a simple news-event trigger.
How AI Can Help Traders Analyse Economic Data
AI can be particularly useful as an information-processing and research layer.
For example, an AI system could monitor economic releases and automatically:
- Collect the latest release.
- Compare actual, forecast and previous values.
- Identify significant surprises.
- Analyse revisions.
- Summarise the underlying components.
- Compare the result with previous releases.
- Monitor market reactions.
- Generate a structured economic briefing.
- Update a trader’s research dashboard.
- Flag events that deserve human attention.
The important distinction is that AI doesn’t need to be responsible for making the final trading decision.
It can instead reduce the amount of information a trader has to manually process.
That creates a powerful model:
Data → AI analysis → Human interpretation → Trading decision
rather than:
Data → AI → Automatic trade
The first approach can preserve human oversight while still benefiting from automation.
A Better Way to Think About Economic Indicators
CPI, NFP, GDP and interest rates shouldn’t be treated as four unrelated calendar events.
They are pieces of a much larger economic system.
CPI helps traders understand price pressures.
NFP helps reveal labour-market conditions.
GDP provides information about economic activity and growth.
Interest rates reflect monetary policy and financial conditions.
But the real trading opportunity often comes from understanding the relationships between them.
A trader who simply memorises:
“High CPI = buy the currency”
has learned a rule.
A trader who understands:
“Higher-than-expected inflation can change expectations about future monetary policy, which can influence bond yields, currency demand and broader asset valuations”
has learned a framework.
And frameworks are much more useful than simplistic rules.
Final Takeaway
When important economic data is released, don’t ask:
“Is this good or bad?”
Ask:
“What did the market expect?”
“What actually happened?”
“How large was the surprise?”
“What does the underlying data say?”
“How might this change expectations for monetary policy?”
“How are interest rates and bond yields responding?”
“How does this fit into the broader economic narrative?”
That is the difference between simply reacting to economic news and actually understanding why economic news moves markets.
The number is the information.
The surprise is the signal.
The market’s repricing is the reaction.
Understanding that distinction is one of the foundations of macroeconomic trading. visit our store to explore our trading solutions