
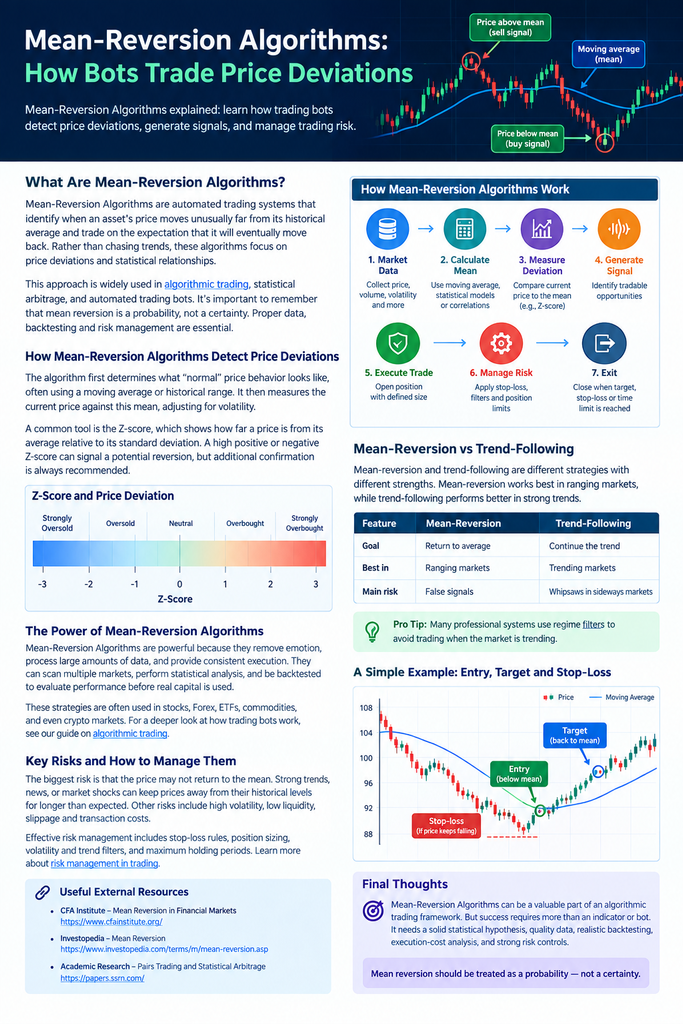
Mean-Reversion Algorithms are automated trading systems designed to identify unusual price movements and trade on the possibility that prices will eventually move back toward their historical average or expected value. Instead of chasing a strong upward or downward trend, these algorithms search for price deviations that may represent temporary market imbalances.
This approach is widely associated with algorithmic trading, quantitative strategies, statistical arbitrage, and automated trading bots. However, mean reversion does not mean that every falling asset will rise again or every rising asset will fall. The strategy works on statistical probabilities, which makes data quality, market conditions, back-testing, and risk management essential.
What Are Mean-Reversion Algorithms?
Mean-Reversion Algorithms are computer-based trading systems that use mathematical and statistical rules to determine when an asset has moved unusually far from its calculated mean.
The mean can be based on:
- A simple moving average
- An exponential moving average
- Historical price ranges
- Volatility-adjusted prices
- Statistical models
- The spread between two assets
- A long-term relationship between correlated markets
The basic concept is straightforward:
Normal price → unusual deviation → algorithm detects deviation → trading signal → potential reversion → position exit.
For example, imagine an asset normally trades around $100. If its price suddenly falls to $90, an algorithm may investigate whether the movement represents an unusually large deviation.
The bot does not automatically assume that $90 is cheap. Instead, it evaluates whether similar deviations have historically been followed by a recovery toward the mean.
That distinction separates a statistical strategy from simply buying after a price decline.
How Mean-Reversion Algorithms Detect Price Deviations
The first major task of Mean-Reversion Algorithms is determining what “normal” price behavior looks like.
A moving average is one of the simplest methods.
Suppose the 20-period moving average of an asset is $100 while the current price is $94. The algorithm identifies a $6 deviation from the average.
However, the absolute difference does not tell the whole story.
A $6 deviation may be significant for an asset that normally moves only $1 or $2 per period. For a highly volatile asset that regularly moves $10, however, the same $6 difference may be insignificant.
This is why sophisticated mean-reversion systems often adjust deviations according to volatility.
Using Z-Scores in Mean-Reversion Algorithm Trading
One of the most common statistical measurements used in Mean-Reversion Algorithms is the Z-score.
A Z-score measures how far a value is from its average relative to its standard deviation.
In practical terms:
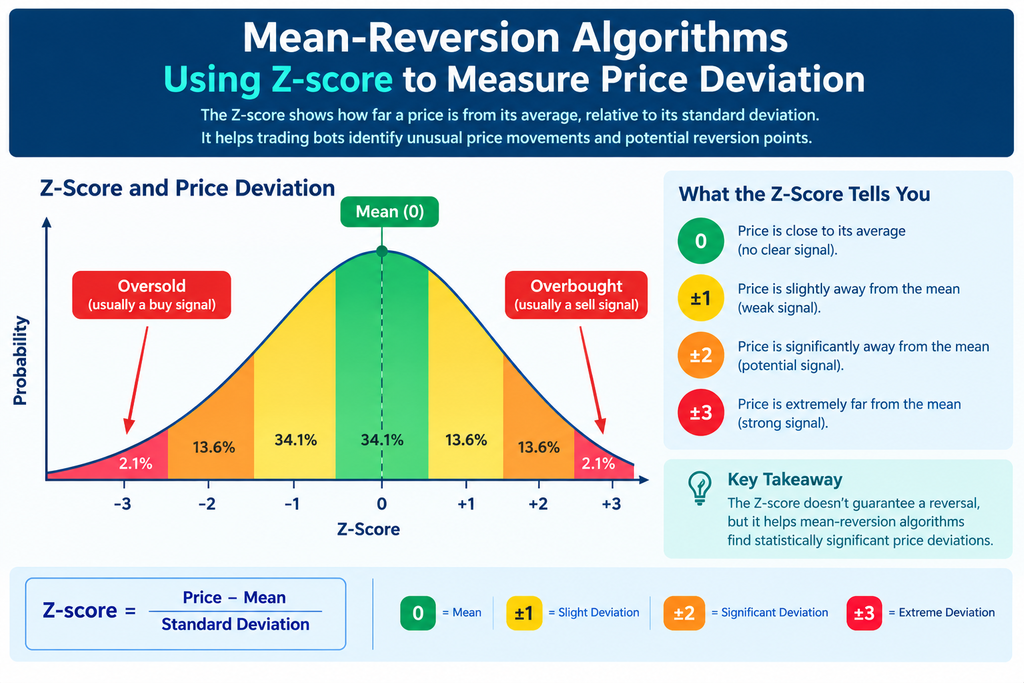
- Z-score near 0: price is close to its historical mean.
- Positive Z-score: price is above the mean.
- Negative Z-score: price is below the mean.
- Large positive or negative Z-score: price is unusually far from the mean.
For example, a strategy might consider a strongly negative Z-score as evidence that price has moved unusually far below its normal level.
The algorithm can then check additional conditions before generating a trade.
This is important because an extreme statistical reading is not automatically a buy or sell signal.
How a Mean-Reversion Algorithm Trading Bot Works
A typical trading bot follows a sequence of predefined rules.
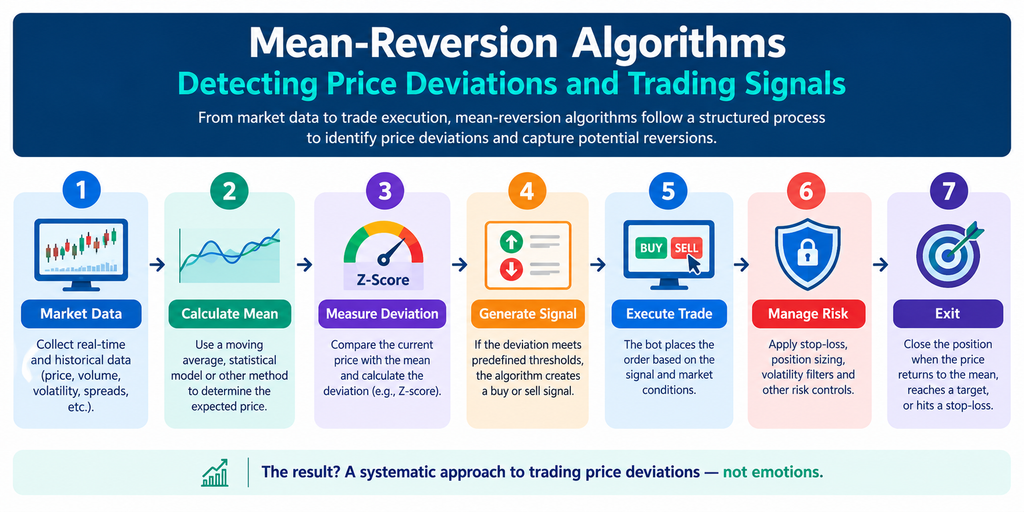
1. Market Data Collection
The algorithm collects information such as:
- Price
- Volume
- Volatility
- Bid and ask prices
- Trading spreads
- Historical data
- Correlations
- Market trends
2. Mean Calculation
The system calculates the reference mean using its selected statistical method.
3. Deviation Measurement
The current price is compared with the calculated mean.
4. Signal Generation
The algorithm determines whether the deviation is large enough to meet its trading conditions.
5. Risk Check
Before entering a position, the bot can evaluate volatility, position size, maximum exposure, market conditions, and other risk parameters.
6. Order Execution
If all conditions are satisfied, the algorithm sends the appropriate order.
7. Position Monitoring
The system continuously monitors the position and evaluates whether the original assumptions remain valid.
8. Exit
The position can be closed when price moves toward the mean, a profit target is reached, a stop-loss is triggered, or another predefined exit condition occurs.
This process allows the strategy to operate systematically rather than relying on human emotions.
Mean-Reversion Algorithms vs Trend-Following Algorithms
The difference between the two approaches is fundamental.
| Mean Reversion | Trend Following |
|---|---|
| Looks for prices to return toward an average | Looks for prices to continue moving |
| Trades potential overextensions | Trades established momentum |
| Often performs better in ranging conditions | Often performs better in trending conditions |
| Can struggle during powerful breakouts | Can struggle during sideways markets |
| Relies heavily on statistical relationships | Relies heavily on directional momentum |
Consider a market that moves between $95 and $105 for several weeks.
A mean-reversion system may attempt to buy near the lower part of the range and sell near the upper part.
Now imagine the market suddenly breaks from $105 to $125 following major economic news.
A trend-following strategy may interpret this as the beginning of a new trend.
A mean-reversion strategy, however, could incorrectly interpret the higher price as an over-extension.
This is one of the most important dangers of mean-reversion trading.
Why Mean-Reversion Algorithms Can Be Powerful
The biggest advantage of Mean-Reversion Algorithms is that they transform a statistical idea into a repeatable process.
They Reduce Emotional Decisions
Fear and greed can cause traders to enter positions too early, hold losing positions too long, or close profitable trades prematurely.
An algorithm follows its programmed rules.
They Process Large Amounts of Data
A bot can continuously evaluate multiple markets, time-frames, prices, and statistical measurements far faster than a human trader.
They Provide Consistent Execution
Once tested and deployed, the same conditions can trigger the same response.
They Can Monitor Multiple Markets
A properly designed system can scan numerous stocks, currency pairs, indices, commodities, effs, or digital assets.
They Can Be back-tested
The strategy can be tested against historical data before risking significant capital.
The real advantage is therefore not that the bot predicts the future. Its advantage is consistent execution of a tested statistical hypothesis.
Statistical Arbitrage and Mean-Reversion Algorithms
Mean-Reversion Algorithms are closely connected with statistical arbitrage.
Instead of analyzing whether one asset is above or below its own average, statistical arbitrage can examine the relationship between two or more assets.
For example, two companies may historically move in a similar direction.
If their relationship suddenly becomes unusually wide, an algorithm may:
- Buy the relatively weaker asset.
- Short the relatively stronger asset.
- Monitor the relationship.
- Close both positions if the spread moves toward normal.
This is commonly associated with pairs trading.
The strategy is not necessarily predicting whether the entire market will rise or fall.
Instead, it attempts to profit from a potential normalization in the relationship between assets.
Pairs Trading Example
Imagine Stock A and Stock B have historically maintained a relatively stable price relationship.
For simplicity:
Stock A − Stock B = relatively stable spread
If Stock A suddenly rises substantially while Stock B remains unchanged, the spread may become unusually large.
A mean-reversion strategy may interpret this as a possible temporary imbalance.
The algorithm could therefore buy one asset and short the other.
If the relationship returns toward its historical range, both positions can be closed.
However, correlation alone is not enough.
Two assets can be correlated for years and later behave differently because of changes in company fundamentals, economic conditions, interest rates, regulation, or market structure.
When Mean-Reversion Algorithms Perform Best
Mean-reversion strategies generally require an environment where the statistical relationship they exploit remains reasonably stable.
They may be more suitable when:
- Prices repeatedly move within established ranges.
- Volatility is relatively stable.
- Market relationships remain consistent.
- Liquidity is sufficient.
- Transaction costs are low.
- There are no major structural disruptions.
The strategy can become vulnerable when the market enters a strong directional trend.
This is why many professional systems include regime filters that attempt to distinguish ranging conditions from trending conditions.
The Biggest Risks of Mean-Reversion Algorithms
The central assumption behind mean reversion is also its greatest weakness:
The price may not return to the mean.
A market can remain overvalued or undervalued for much longer than a trader expects.
Imagine a stock historically trading around $100.
The price rises to $120, and the algorithm identifies the move as an unusually large deviation.
The system opens a short position expecting a reversal.
Instead, the company announces unexpectedly strong earnings, and the stock rises to $150.
The algorithm’s historical assumption has now been challenged by new information.
Major risks include:
- Strong market trends
- Unexpected news
- Economic shocks
- Structural market changes
- High volatility
- Low liquidity
- Slippage
- Transaction costs
- False statistical signals
- over-fitting
- Correlation breakdown
Therefore, risk management must be built into the algorithm rather than added after the strategy has been created.
Risk Management for Mean-Reversion Algorithms
A profitable back-test does not make a trading strategy safe.
Effective Mean-Reversion Algorithms should contain clearly defined risk controls.
Stop-Loss Rules
A stop-loss can limit losses if price continues moving away from the expected mean.
Position Sizing
The system should determine how much capital to risk on each position.
Maximum Drawdown
A drawdown limit can reduce exposure or temporarily stop trading after a specified level of losses.
Volatility Filters
The bot can reduce trading activity when volatility becomes unusually high.
Trend Filters
Trend filters can help prevent the system from repeatedly betting against powerful market movements.
Maximum Holding Period
A position can be closed if the expected reversion does not occur within a reasonable time-frame.
These safeguards are especially important because a mean-reversion strategy can experience several losses during a persistent trend.
back-testing Mean-Reversion Algorithms
Before deploying Mean-Reversion Algorithms with real capital, historical testing should be performed.
back-testing applies the strategy’s rules to historical market data to estimate how it might have behaved under previous market conditions.
Important performance measurements include:
- Total return
- Maximum drawdown
- Win rate
- Average winning trade
- Average losing trade
- Profit factor
- Sharpe ratio
- Number of trades
- Holding period
- Trading costs
- Slippage
However, an excellent back-test can still produce a poor live strategy.
One major reason is over-fitting.
over-fitting occurs when a strategy is excessively optimized for historical data. The algorithm may appear extremely accurate because it has effectively adapted to historical noise rather than discovering a robust market relationship.
A stronger testing process can include:
Historical testing → parameter validation → out-of-sample testing → paper trading → controlled live deployment
This helps determine whether the strategy can survive data it has never seen before.
Transaction Costs Matter
One of the easiest mistakes in automated trading is ignoring the cost of execution.
Suppose a mean-reversion strategy captures very small price movements.
A theoretical back-test may show hundreds of profitable trades.
But after accounting for:
- Spread
- Commission
- Slippage
- Exchange fees
- Financing costs
the expected profit may disappear.
This is particularly important for high-frequency or short-term mean-reversion systems.
A strategy should therefore be tested using realistic trading costs rather than assuming that every order will execute at the historical price displayed on a chart.
Can Artificial Intelligence Improve Mean-Reversion Algorithms?
Artificial intelligence and machine learning can potentially make Mean-Reversion Algorithms more adaptive.
A traditional strategy may use a simple rule:
If price moves sufficiently far from the mean, consider entering a trade.
A machine-learning system can potentially evaluate several variables simultaneously, including:
- Price deviation
- Volatility
- Momentum
- Volume
- Market trend
- Liquidity
- Correlation
- Time of day
- Broader market conditions
The objective is to determine whether a particular deviation is historically associated with a higher probability of reversion.
However, AI does not eliminate trading risk.
Machine-learning systems can suffer from:
- over-fitting
- Data leakage
- Poor-quality data
- Model drift
- Changing market regimes
- Unstable relationships
A more complex model is not automatically a better model.
Common Mistakes When Building Mean-Reversion Algorithms
Mistake 1: Assuming Every Extreme Price Will Reverse
An extreme price can remain extreme or become even more extreme.
Mistake 2: Ignoring Market Regimes
A strategy designed for a sideways market may perform poorly during a strong trend.
Mistake 3: Over-Optimizing
Too many parameters can make a strategy fit historical noise.
Mistake 4: Ignoring Costs
Spreads, commissions, and slippage can eliminate a small statistical edge.
Mistake 5: Using Weak Correlations
A relationship that appears stable may not have a reliable economic or statistical foundation.
Mistake 6: Risking Too Much
A high win rate does not protect a strategy from a few severe losses.
Mistake 7: Testing Only One Market
A strategy that works on one asset may fail when market conditions change.
A Simple Mean-Reversion Algorithm Example
Consider a simplified strategy using a 20-period moving average.
The rules might look like this:
Entry:
Price moves significantly below the 20-period average and satisfies the strategy’s volatility and market-condition filters.
Confirmation:
The deviation reaches the system’s predefined statistical threshold.
Position:
The algorithm opens a long position according to its risk parameters.
Target:
Price moves back toward the calculated mean.
Protection:
A stop-loss is placed if price continues moving against the position.
Exit:
The position closes when the target, stop-loss, or maximum holding period is reached.
This example is intentionally simplified. A production trading system would normally require additional validation, execution logic, risk controls, and monitoring.
What Makes a Good Mean-Reversion Algorithm Strategy?
A strong Mean-Reversion Algorithms framework should answer five questions clearly:
- What defines the mean?
- How large must the deviation become?
- What confirms that the deviation is tradable?
- Where is the trade invalidated?
- How much capital can be risked?
If these questions cannot be answered objectively, the strategy may be relying too heavily on assumptions rather than a repeatable trading process.
The strongest systems also recognize when not to trade.
Sometimes the best algorithmic decision is to remain out of the market because volatility, trend strength, liquidity, or other conditions do not support the strategy.
Final Thoughts on Mean-Reversion Algorithms
Mean-Reversion Algorithms offer a powerful way to automate strategies based on temporary price deviations and statistical relationships.
Their appeal comes from a simple idea: markets sometimes move away from established averages or relationships and later move back toward them.
But the market is not obligated to revert.
A successful system therefore requires more than an indicator or trading bot. It needs a well-defined statistical hypothesis, quality data, realistic back-testing, execution-cost analysis, risk controls, and continuous evaluation.
The most important lesson is this:
Mean reversion should be treated as a probability—not a certainty.
When statistical analysis, automation, and disciplined risk management are combined, mean-reversion strategies can become a valuable part of a broader algorithmic trading framework.
visit our store to explore our trading solutions