
Introduction
Market structure is one of the fundamental concepts behind technical analysis. Before a trader begins relying on indicators, patterns, or automated trading systems, it is important to understand what price itself is doing.
At its simplest, market structure is the way price moves from one significant high or low to another.
By studying these movements, traders attempt to determine whether a market is:
- Moving upward
- Moving downward
- Trading sideways
- Breaking out of an existing structure
- Potentially changing direction
Understanding market structure can help traders make sense of seemingly chaotic price movements and create more systematic approaches to analysing the market.
What Is Market Structure?
Market structure refers to the sequence of highs and lows created by price over time.
Imagine a market that repeatedly creates:
Higher High → Higher Low → Higher High → Higher Low
This tells us something important: buyers are generally pushing price higher.
Conversely, a sequence such as:
Lower High → Lower Low → Lower High → Lower Low
suggests that sellers are maintaining control.
However, market structure should not be interpreted as simply “price went up, therefore buy” or “price went down, therefore sell.” Traders need to consider the significance of each swing, the timeframe being analysed, volatility, liquidity and the broader market environment.l.” Traders need to consider the significance of each swing, the timeframe being analysed, volatility, liquidity and the broader market environment.
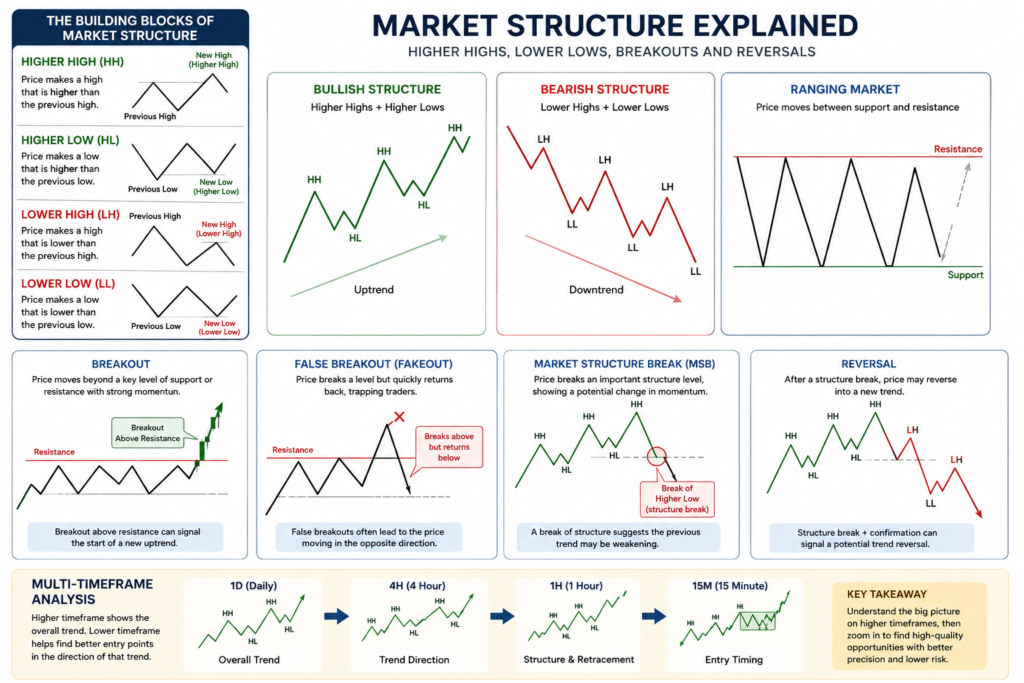
The Four Basic Components of Market Structure
To understand market structure, you first need to understand four terms:
1. Higher High (HH)
A Higher High occurs when price moves above a previous significant high.
For example:
Previous high: 1.2000
New high: 1.2100
The market has created a Higher High.
A series of Higher Highs can indicate that buyers are successfully pushing the market upward.
2. Higher Low (HL)
A Higher Low occurs when price pulls back but does not fall below the previous significant low.
For example:
Previous low: 1.1900
Pullback low: 1.1950
The market has created a Higher Low.
Higher Lows are important because they suggest that buyers are entering the market before price returns to the previous low.
A typical bullish structure therefore looks like:
HH → HL → HH → HL → HH
3. Lower High (LH)
A Lower High occurs when price attempts to move upward but fails to reach the previous significant high.
For example:
Previous high: 1.2500
New high: 1.2400
The new high is lower than the previous one.
This creates a Lower High.
Repeated Lower Highs can indicate weakening buying pressure.
4. Lower Low (LL)
A Lower Low occurs when price falls below a previous significant low.
For example:
Previous low: 1.2300
New low: 1.2200
The market has created a Lower Low.
A typical bearish structure therefore looks like:
LH → LL → LH → LL → LH
Bullish Market Structure
A bullish market generally produces:
Higher Highs + Higher Lows
For example:
             HH
            /  \
           /    \
      HL  /      \
       \ /        \
        /          HH
       /           / \
      /           /   \
     /      HL   /     \
    /       \   /       \
The important thing isn’t simply that price is rising.
The important thing is how price is rising.
If each major pullback holds above the previous significant low and price subsequently breaks above previous highs, the market is demonstrating a bullish structure.
Bearish Market Structure
A bearish market generally produces:
Lower Highs + Lower Lows
For example:
    LH
     /\
    /  \
   /    \       LH
  /      \     /\
 /        \   /  \
           LL     \
                  \
                   LL
Here, sellers are consistently able to push price below previous lows, while buyers are unable to reclaim previous highs.
This creates a descending structure.
What Is a Market Range?
Not every market is trending.
Sometimes price moves between relatively defined areas of support and resistance.
For example:
Resistance
↓
Price moves down
↓
Support
↓
Price moves up
↓
Resistance
This is known as a range or sideways market.
During a range, neither buyers nor sellers have established sustained control.
This is important because a strategy designed for trending markets may perform poorly when the market enters a range.
What Is a Breakout?
A breakout occurs when price moves beyond an established market structure or trading range.
For example, imagine price repeatedly reaches a resistance level around 1.3000 but fails to move above it.
Eventually, price moves decisively above that area.
This may be interpreted as a bullish breakout.
However, not every move beyond resistance is a genuine breakout.
This is where traders need to distinguish between a breakout and a false breakout.
What Is a False Breakout?
A false breakout occurs when price moves beyond an important level but fails to sustain the move.
For example:
- Price approaches resistance.
- Price moves above resistance.
- Traders enter expecting continuation.
- Price quickly falls back below the level.
- The breakout fails.
This is sometimes referred to as a fakeout.
False breakouts are one reason traders shouldn’t automatically enter a position simply because price has crossed a previous high or low.
Confirmation, context and risk management matter.
What Is a Market Structure Break?
A market structure break occurs when price violates an important point within the existing structure.
Consider a bullish market:
HH → HL → HH → HL
If price subsequently falls below the most recent important Higher Low, the bullish structure may be weakening.
That doesn’t automatically mean the market will reverse.
Instead, it tells the trader:
Something has changed in the previous structure.
This distinction is extremely important.
A structure break can be an early warning, rather than a guaranteed reversal signal.
Market Structure Break vs Reversal
One of the biggest mistakes beginners make is assuming that every structure break means an immediate reversal.
Suppose a market has been bullish for several hours.
Price creates:
HH → HL → HH
Then price breaks below the latest HL.
That could indicate weakening bullish momentum.
But several possibilities remain:
- Price could reverse into a downtrend.
- Price could enter a range.
- Price could make a deeper correction before continuing upward.
- The apparent structure break could simply be market noise.
Therefore, traders should analyse the larger structure and timeframe, rather than making decisions based on one candle or one price movement.
Internal vs External Market Structure
This becomes particularly useful for more advanced traders.
A market can contain multiple layers of structure simultaneously.
For example, the daily chart may show a strong bullish trend while the 15-minute chart is moving downward.
There is no contradiction.
The smaller timeframe movement may simply be a correction within the larger bullish structure.
This is why timeframe selection matters.
A trader looking only at a lower timeframe could conclude:
“The market is bearish.”
While a trader looking at the higher timeframe could see:
“The market is bullish, but currently experiencing a pullback.”
Both observations may be correct within their respective timeframes.
Multi-Timeframe Market Structure
A useful way to analyse structure is to work from the larger timeframe toward the smaller timeframe.
For example:
Daily → 4-Hour → 1-Hour → 15-Minute
The higher timeframe can provide broader context, while the lower timeframe can help traders examine more detailed price movements.
A simplified process might look like:
Step 1 — Identify the higher-timeframe structure
Is the market:
- Bullish?
- Bearish?
- Ranging?
Step 2 — Identify important swing points
Mark significant:
- Highs
- Lows
- Support
- Resistance
Step 3 — Move to a lower timeframe
Look for how price behaves around those important areas.
Step 4 — Look for confirmation
Instead of assuming that a level will hold or break, observe what price actually does when it reaches the area.
Why Market Structure Matters for Trading Strategies
Market structure can become the foundation for a trading system.
For example, a simple rule-based strategy might define a bullish environment as:
Price is creating Higher Highs and Higher Lows on the selected timeframe.
The system could then look for particular conditions before considering an entry.
This is where market structure becomes particularly interesting for algorithmic trading and automation.
A computer doesn’t understand a chart the same way a human visually does.
If you want software to identify market structure, you need to translate concepts such as:
- “Significant high”
- “Significant low”
- “Breakout”
- “Trend”
- “Reversal”
into precise, measurable rules.
For example:
“A significant high is a candle whose high is greater than the highs of the X candles before and after it.”
Now the concept becomes something that can potentially be detected programmatically.
Can Market Structure Be Automated?
Yes, but this is where things become more complicated.
A human trader might look at a chart and immediately identify what appears to be an important swing high.
An algorithm needs an exact definition.
You might need to specify:
- How many candles define a swing?
- How large must a movement be?
- What timeframe should be used?
- How much price movement qualifies as a meaningful break?
- Should wicks count?
- Should candle closes count?
- How should volatility affect the definition?
These decisions can dramatically change the results of an automated strategy.
This is one of the reasons turning a discretionary trading strategy into an automated system is not simply a matter of programming the strategy into a computer.
The strategy first needs to be clearly defined.
Common Market Structure Mistakes
Mistake 1: Treating Every High and Low as Significant
Markets create countless small fluctuations.
Not every tiny movement represents meaningful structure.
Mistake 2: Ignoring the Timeframe
A bearish movement on a 5-minute chart doesn’t necessarily mean the overall market is bearish.
Mistake 3: Assuming Every Breakout Will Continue
Breakouts can fail.
Mistake 4: Confusing a Pullback With a Reversal
A temporary decline during an uptrend doesn’t automatically mean the trend has ended.
Mistake 5: Changing the Rules After Seeing the Chart
This is particularly dangerous when developing automated or backtested strategies.
If traders continually change their definition of structure to fit historical price movements, they can create a strategy that looks excellent in hindsight but performs poorly in live markets.
Market Structure and Trading Psychology
Understanding structure can also help traders avoid emotional decisions.
Instead of thinking:
“Price is going up, I need to buy!”
A structured trader can ask:
- What is the current market structure?
- Where are the significant highs and lows?
- Has the structure changed?
- Is this a trend or a range?
- Where could my trade idea be proven wrong?
- What is the risk?
This shifts the decision-making process from emotion to a defined framework.
Visit our
visit our store to explore our trading solutions